Recently I’ve been able to replace my Visual Studio 2010 Professional with Visual Studio 2010 Ultimate and the first feature I wanted to try was IntelliTrace, to see how it could help me debug and improve the quality of my software.
After giving a look at what it’s capable the first and simple way I used it was to look at all the exception messages raised by my applications; just looking at them I was able to discover and eliminate some ‘hidden’ problem which were simply eaten up the framework (in case of bindings errors for example) or by a wrong exception handling strategy that was implemented in code.
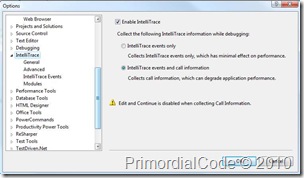
To enable IntelliTrace go to Tools -> Options and look for the IntelliTrace section there, you will see the following dialog:
Figure 1 - IntelliTrace Options
If you want to enable detailed information for the call tree enable the second option, but it will slow down your debugging experience a lot, so do it if you really need those information; I will also suggest you to check the advanced tab and increase the default size of the maximum amount of disk space for each recording.
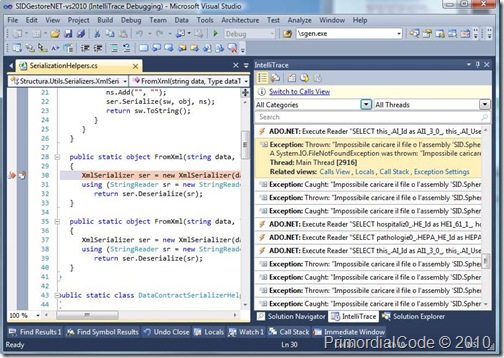
Run the application with the debugger attached and when you break it you can analyze the IntelliTrace log:
Figure 2 - IntelliTrace in action, full event log
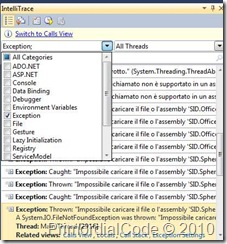
Clicking on an entry will open up the corresponding source code file and will highlight the line of interest. The default view is quite messy, because it contains logs for each type of event you asked for in the IntelliTrace Options, you can filter it up easily and show only what you want to focus on (the exceptions at the moment).
Figure 3 - Filtering the data
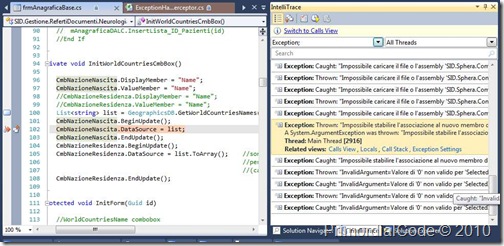
Wow! I never expected that my application raised so many exceptions under the hood, so I started to look at them to see if I could fix them. Inspecting this log you can see all the exceptions that ‘flows’ out of your direct control. Some of them are particularly nasty, like the ones originated from the binding system, take the following one as example:
Figure 4 - Analyzing a single exception.
Here we have a binding to a ComboBox which should hold a list of names of nations, using the software everything was working well: I could see the nations and select them and the value was correctly saved. But internally we had a System.ArgumentException that was throw and eaten up by the binding framework...why? looking at the code it’s quite clear: we are making a binding with a list of strings but we’ve also specified DisplayName and DisplayValue (maybe this control was previously in binding with something else) and this is a mistake we ignored because it has no evident effect.
The binding framework just ignores those two values...but nonetheless an avoidable exception has been thrown and captured; the solution in this case is easy: remove the assignments to DisplayMember and ValueMember.
Using IntelliTrace in this way and carefully looking at the logs I was able to remove a lot of those hidden exceptions (especially when dealing with bindings) with an overall improvement of the quality (and performance) of the application.
Related Content
- NUnitit: Visual Studio Addin to support NUnit and some customizations to it (26/08/2015)
- Resharper and the OutOfMemoryException problem (26/08/2015)
- Visual Studio 2010 designer error: Value cannot be null. Parameter name: objectType (26/08/2015)
- VS2008 SP1 + PowerCommands = Toolbox AddItems...Crash! (26/08/2015)
- How to update your TFS Workspace after CodePlex upgrade to TFS2010 (26/08/2015)
- More related document (10)


